XGC-S Output Parameters
At the moment XGC-S has a separate output from the main tokamak XGC code. The output is limited compared to main XGC, but we are continuously adding more ADIOS2 output. The available ADIOS2 output in XGC-S contains the same output parameters as main XGC, but there can be an additional dimension for the radial-poloidal plane number since each plane has a different mesh. Moreover, XGC-S also outputs files with ASCII data.
ASCII output
XGC-S outputs ASCII files nnnnnn_*****_######.fd2D and nnnnnn_*****_######.tn2D where nnnnnn is the output files prefix given by sml_outfile_s in the XGC-S Input Parameters, ***** is the plane index and ###### is the time step.
nnnnnn_*****_######.fd2D file content
(Mesh output)
nnnnnn_*****_######.tn2D file content
(Physics quantities output)
Plot with gnuplot
The perturbed potential in a plane can plotted using gnuplot:
> gnuplot --persist -e 'plot "w7x_te_00045_002000.tn2D" using 2:3:5 lc palette'
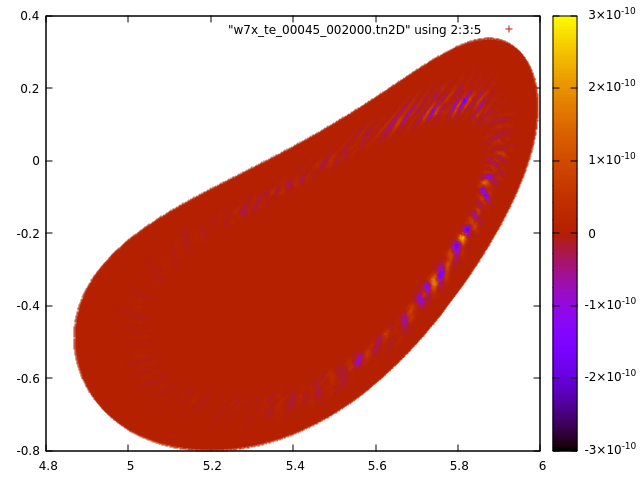
Fig. 1: Example of the perturbed electrostatic potential illustrated with gnuplot.
ADIOS2 output
At the moment the XGC-S ADIOS2 output includes quantities to plot the potential. We provide some Python scripts for plotting in XGC-Devel/XGC-S/utils/python/. To be able to read ADIOS2 in Python
import adios2
follow the instructions here. On the Princeton Stellar cluster
> module load anaconda3/2023.3
> export PYTHONPATH=/projects/XGC/STELLAR/Software/install/adios2/2.8.3_python/gcc-8/lib/python3.10/site-packages/adios2
should be sufficient.
Use the Python scripts in the XGC-S run directory to plot perturbed quantities
> python xgc_2D_dpot.py
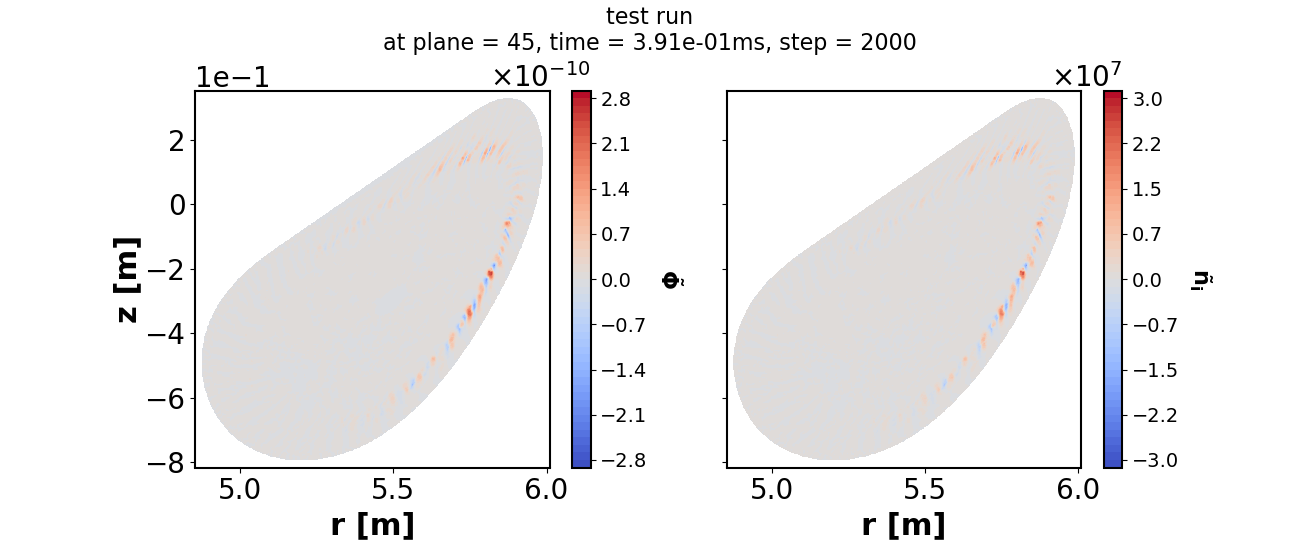
Fig. 2: Example of perturbed quantities illustrated with Python.
and linear growth rate
> python xgc_linear_growth_rate.py
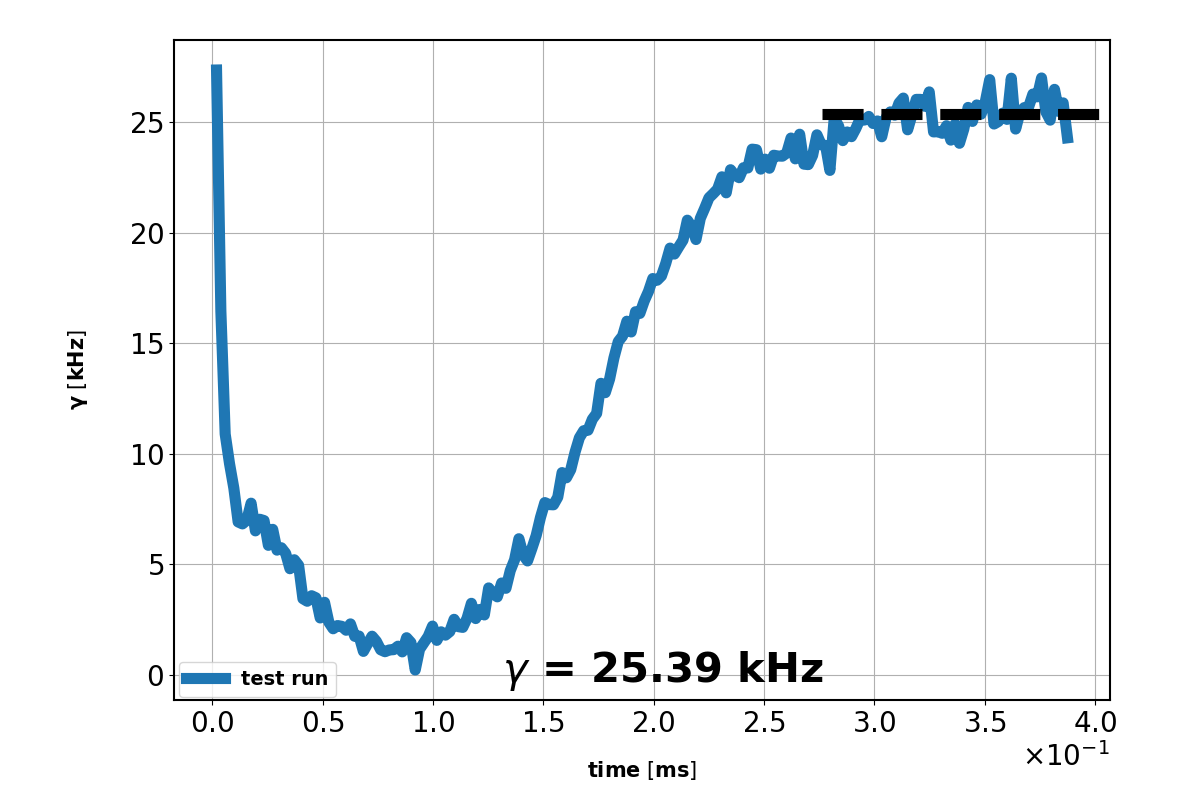
Fig. 3: Example of a linear growth rate calculation illustrated with Python.