Functions/Subroutines | |
| subroutine | init_perf_monitor () |
| subroutine | flush_perf_monitor (istep) |
| subroutine | finish_perf_monitor () |
| subroutine | t_startf (eventname) |
| subroutine | t_stopf (eventname) |
| subroutine | t_adj_detailf (adjustment) |
| subroutine | t_set_prefixf (prefix_string) |
| subroutine | t_unset_prefixf () |
Function/Subroutine Documentation
◆ finish_perf_monitor()
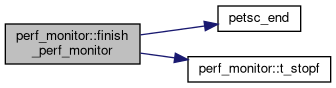
| subroutine perf_monitor::finish_perf_monitor |
Here is the call graph for this function:
◆ flush_perf_monitor()
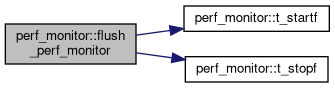
| subroutine perf_monitor::flush_perf_monitor | ( | integer, intent(in), value | istep | ) |
Here is the call graph for this function:
◆ init_perf_monitor()
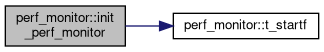
| subroutine perf_monitor::init_perf_monitor |
Here is the call graph for this function:
◆ t_adj_detailf()
| subroutine perf_monitor::t_adj_detailf | ( | integer, intent(in) | adjustment | ) |
◆ t_set_prefixf()
| subroutine perf_monitor::t_set_prefixf | ( | character(len=*), intent(in) | prefix_string | ) |
◆ t_startf()
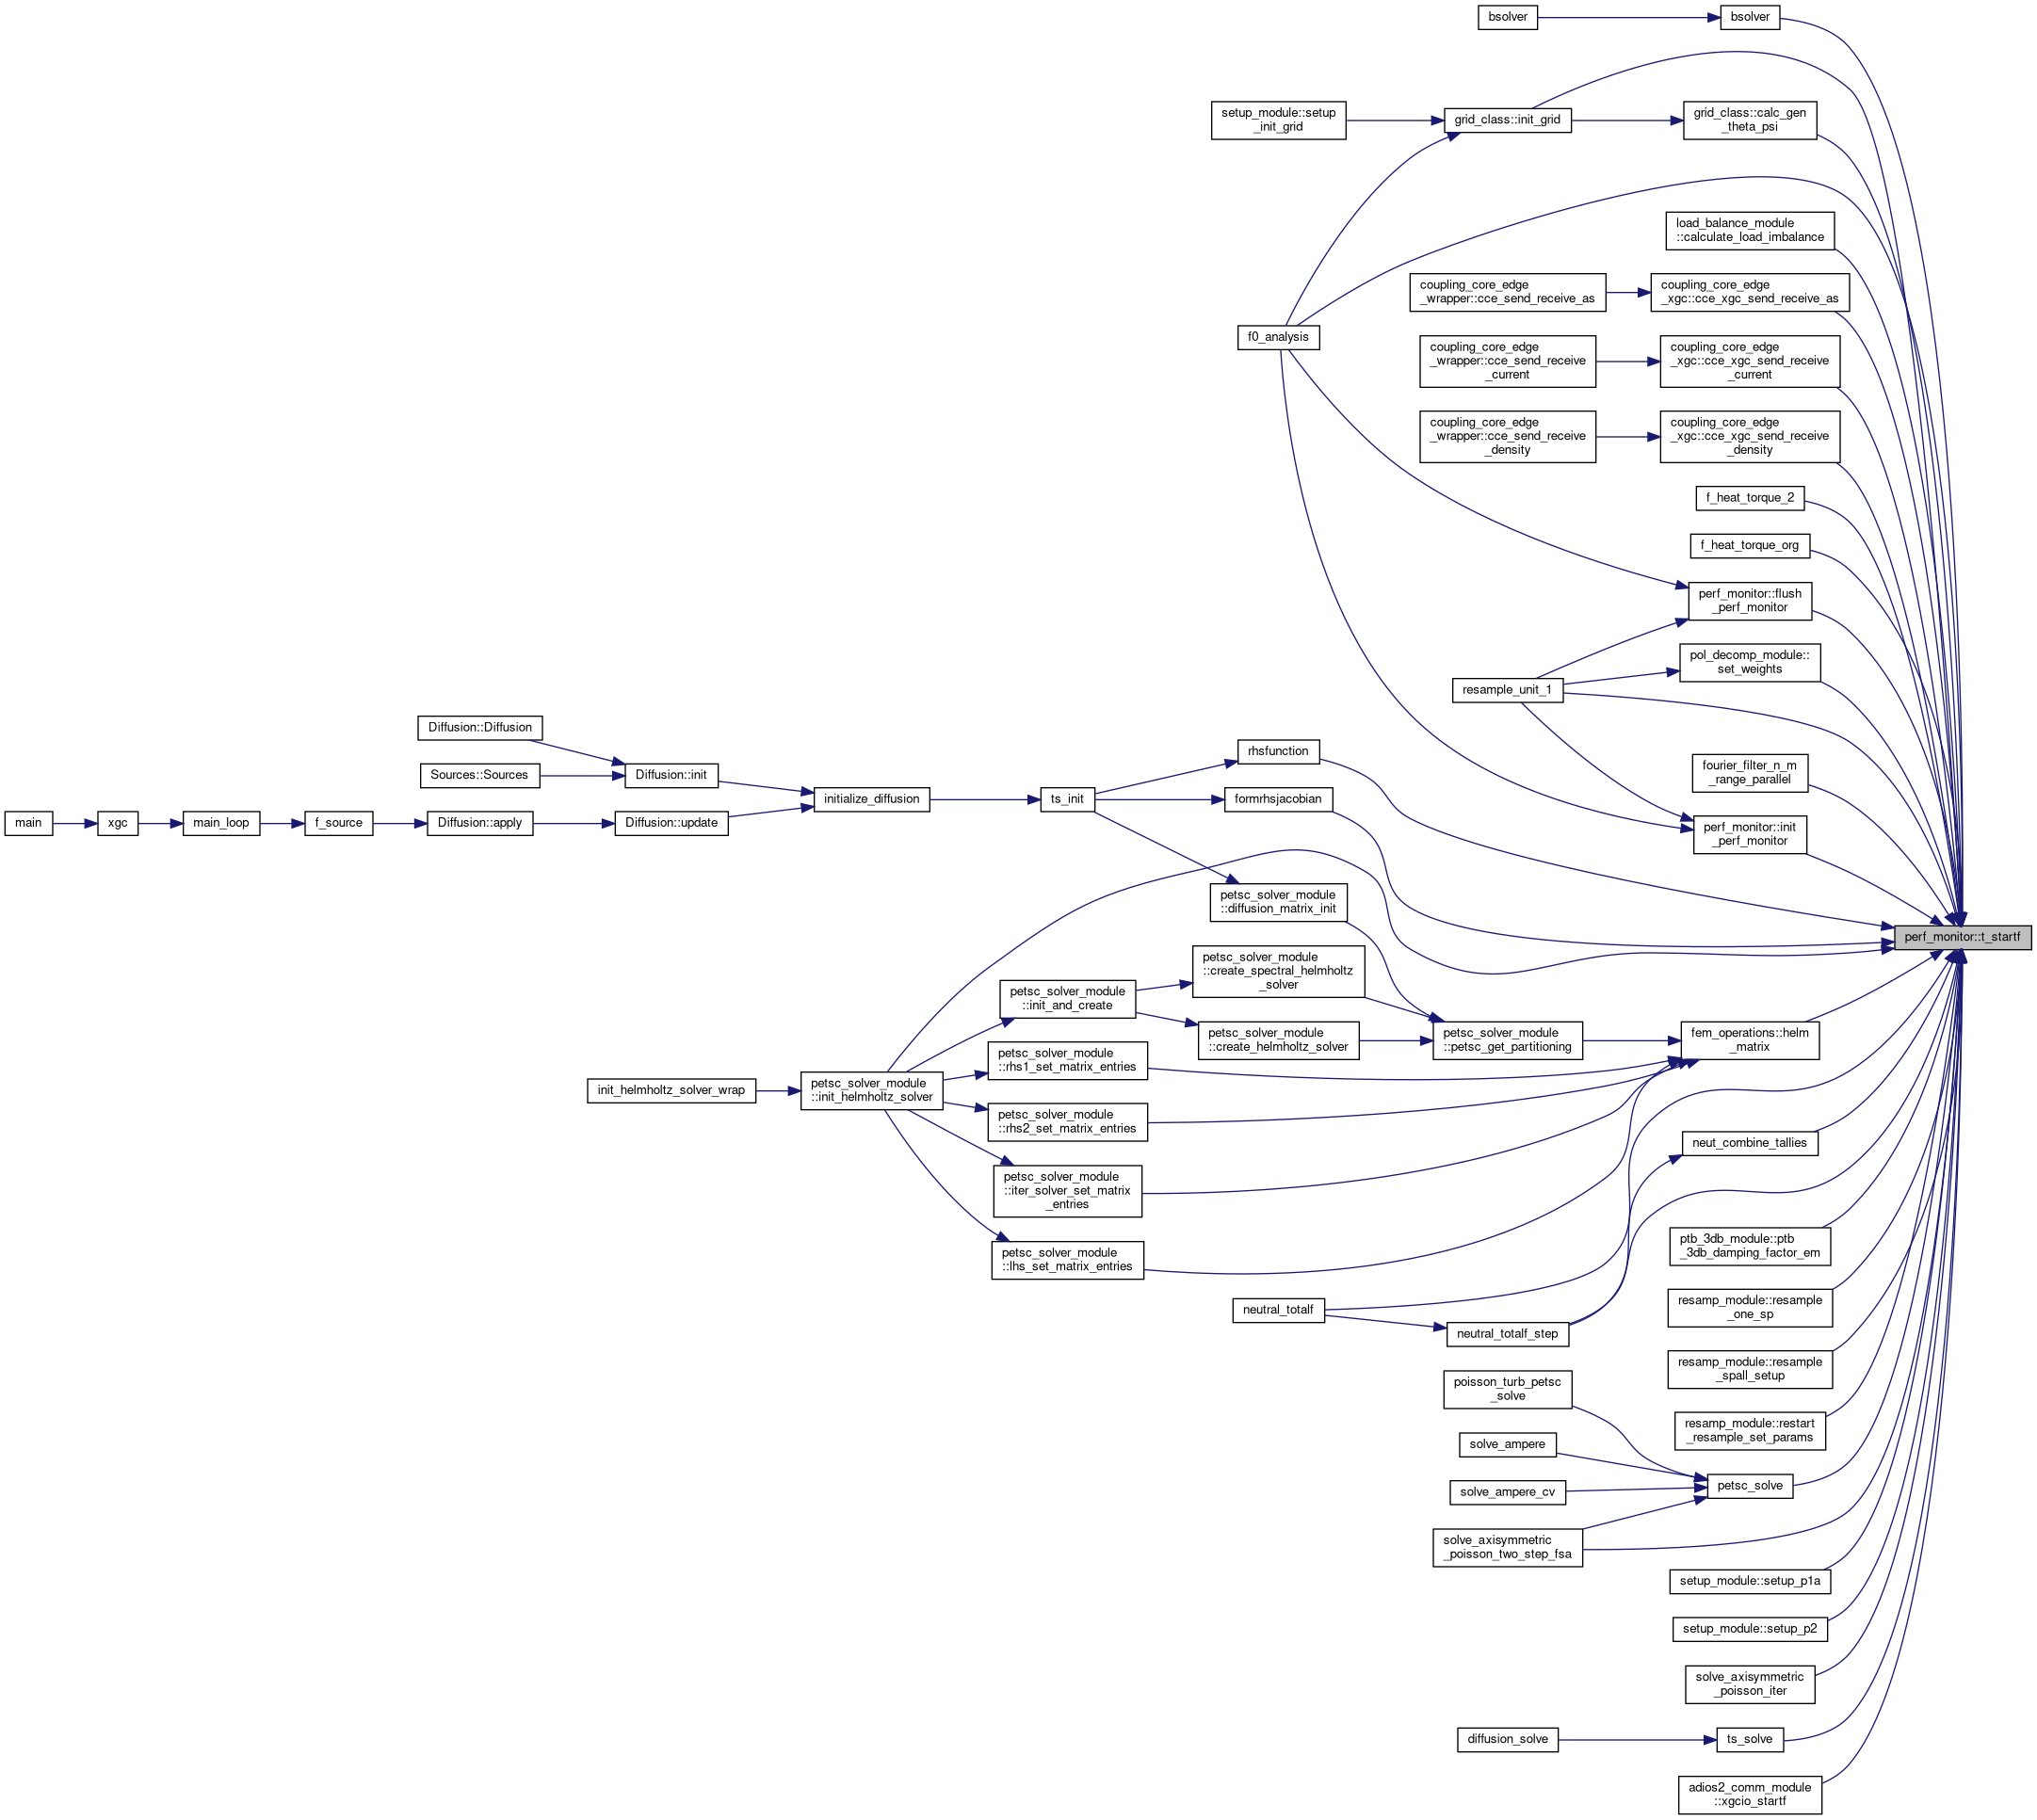
| subroutine perf_monitor::t_startf | ( | character(len=*), intent(in) | eventname | ) |
Here is the caller graph for this function:
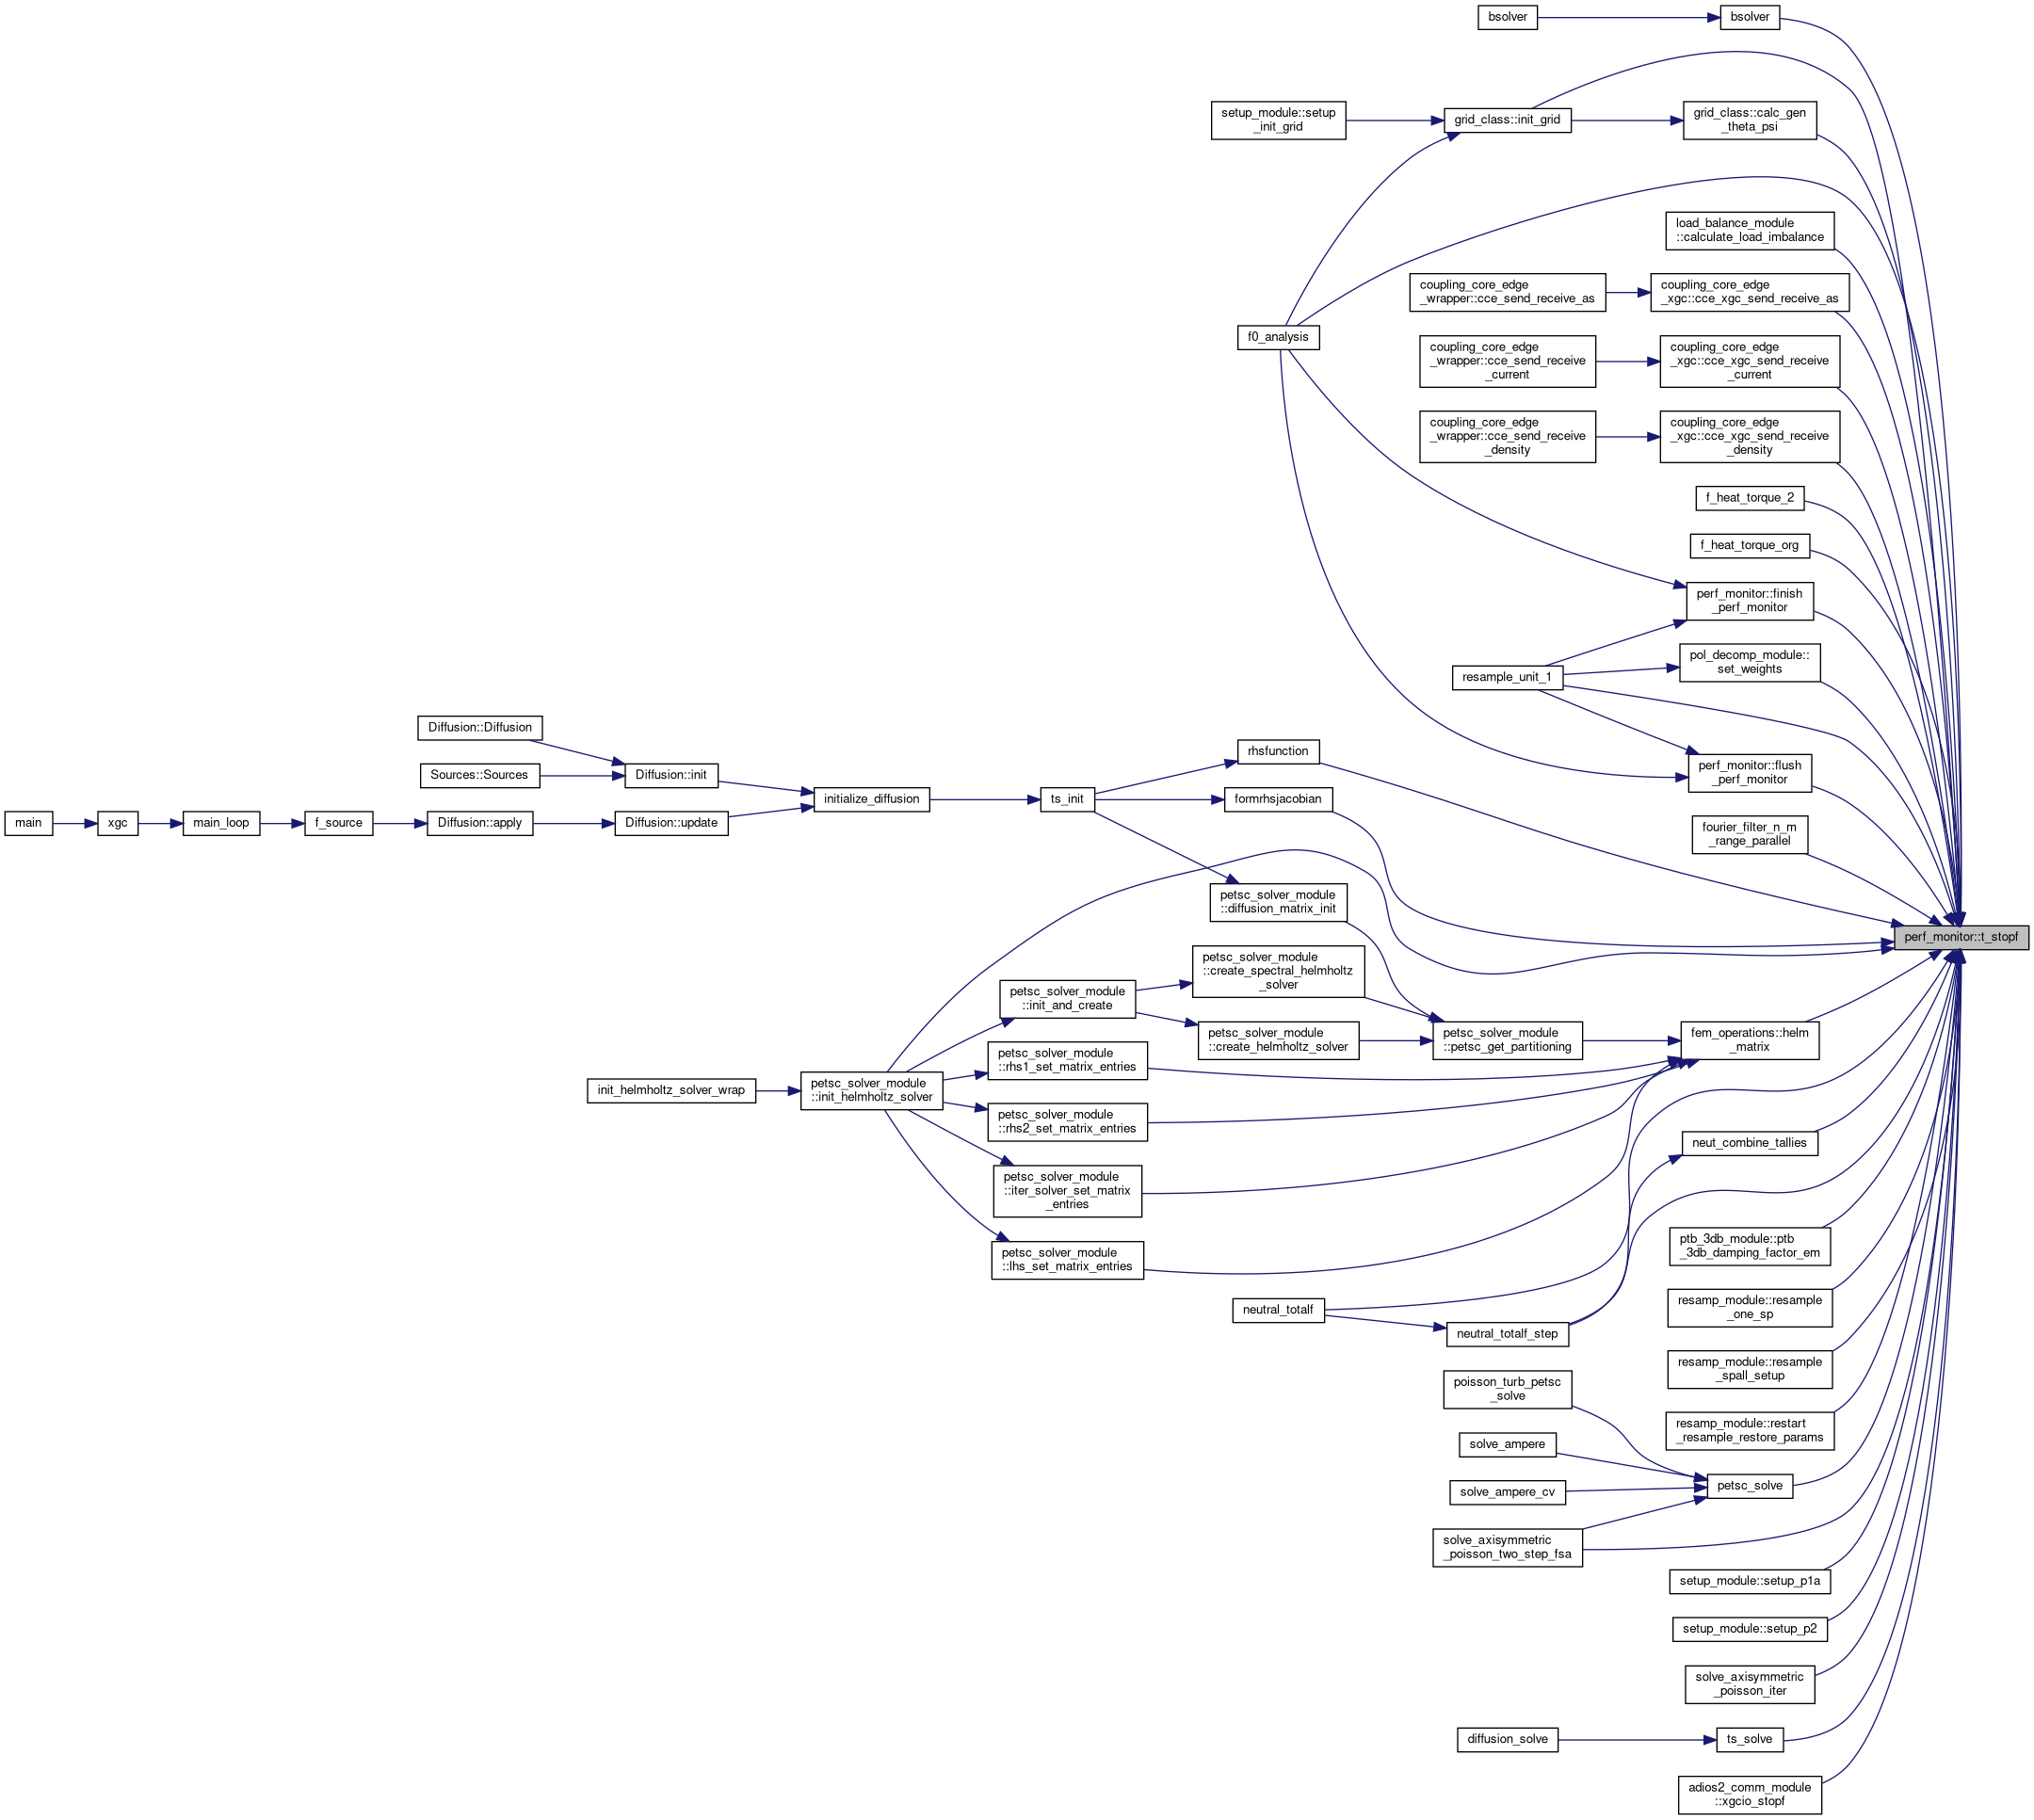
◆ t_stopf()
| subroutine perf_monitor::t_stopf | ( | character(len=*), intent(in) | eventname | ) |
Here is the caller graph for this function:
◆ t_unset_prefixf()
| subroutine perf_monitor::t_unset_prefixf |